
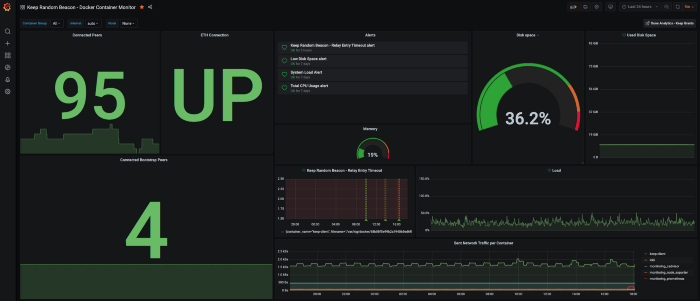
Grafana Node Monitoring Dashboard for reuse
Keep Random Beacon - Node Monitor (with KEEP Metrics) on GrafanaLabs
Project Link
About
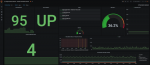
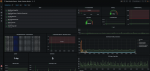
The dashboard provides information on critical metrics like:
https://snapshot.raintank.io/dashboard/snapshot/7x2TcDEDpfjlibcew0ZKwOdI1DcqOdTs?orgId=2
Guide:
Part 1 - https://medium.com/@hr12rtk/keep-random-beacon-node-monitoring-grafana-prometheus-and-loki-4a4b669b31ea
Part 2 - https://medium.com/@hr12rtk/keep-random-beacon-node-monitoring-part-2-5cd037464a6e
- number of connected peers,
- hard disk usage,
- memory usage,
- ETH connectivity and visibility of relay entry requests.
https://snapshot.raintank.io/dashboard/snapshot/7x2TcDEDpfjlibcew0ZKwOdI1DcqOdTs?orgId=2
Guide:
Part 1 - https://medium.com/@hr12rtk/keep-random-beacon-node-monitoring-grafana-prometheus-and-loki-4a4b669b31ea
Part 2 - https://medium.com/@hr12rtk/keep-random-beacon-node-monitoring-part-2-5cd037464a6e