Keep / tBTC Explorer
Keep / tBTC Explorer with Transfers, Stake events, Grants. Visualization Charts also available.
About
The project's aim is a website which displays KEEP and TBTC information, like token transfers, stake events, other events,… and visualize interesting data.
The backend (API): Node.js express API, web3.js and mongoose
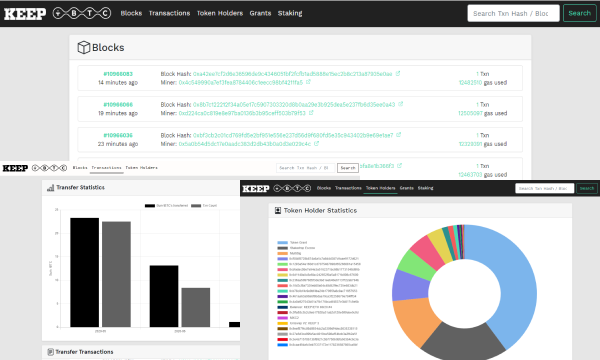
The backend scans (via polling) every 30 seconds the blockchain for contract addresses events, which could be configured in a configuration file and stores the data (blocks, transactions, event transaction) to a mongo database. You also can configure the starting block. I am using web3.js, the etherscan API (getting ABI contracts) and infura for getting the data. The goal would be to get the data from a remote node, not infura. Attached you can find how the frontend looks like (web and mobile). The ‘home’ site displays the latest blocks and transactions and some main analytics (the chart is just a preview demo). It is also possible to filter KEEP and TBTC tokens and view all blocks/transactions paginated.
UPDATE: After reviewing thegraph.com. Spent now 6 hours learning how thegraph works. I created a subgraph (https://thegraph.com/explorer/subgraph/tibike6/keep) and will use this for now as backend. I will deploy my frontend in the next days.
Next steps for backend are:
Feel free to contact me if you have any problems, questions or ideas.
The backend (API): Node.js express API, web3.js and mongoose
- Get data from the blockchain, store and aggregate the data (if needed), provide data for frontend via REST API The frontend: Angular
- Display the data
The backend scans (via polling) every 30 seconds the blockchain for contract addresses events, which could be configured in a configuration file and stores the data (blocks, transactions, event transaction) to a mongo database. You also can configure the starting block. I am using web3.js, the etherscan API (getting ABI contracts) and infura for getting the data. The goal would be to get the data from a remote node, not infura. Attached you can find how the frontend looks like (web and mobile). The ‘home’ site displays the latest blocks and transactions and some main analytics (the chart is just a preview demo). It is also possible to filter KEEP and TBTC tokens and view all blocks/transactions paginated.
UPDATE: After reviewing thegraph.com. Spent now 6 hours learning how thegraph works. I created a subgraph (https://thegraph.com/explorer/subgraph/tibike6/keep) and will use this for now as backend. I will deploy my frontend in the next days.
Next steps for backend are:
- use Websockets to retrieve data from blockchain and update the frontend
- add mongo database seeding
- block and transaction details page
- add some useful visualization
- display stake transactions
- add more filter possibilities
- … I have no deployed version, but I have put a lot of time in setting up the project with docker. It should be easy to try, test and contribute. You will need docker, a free etherscan API key, and a free infura endpoint. The source code could be found here: https://github.com/Tibike6/keep-explorer
Feel free to contact me if you have any problems, questions or ideas.


